
Page 10 - Water-energy_2020
P. 10
F. Calise, et al. Energy Conversion and Management 220 (2020) 113043
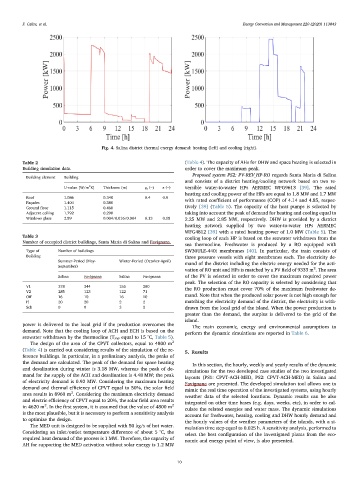
Fig. 4. Salina district thermal energy demand: heating (left) and cooling (right).
Table 2 (Table 4). The capacity of AHs for DHW and space heating is selected in
Building simulation data. order to cover the maximum peak.
Proposed system PS2: PV-REV_HP-RO regards Santa Maria di Salina
Building element Building
and consists of a district heating/cooling network based on two re-
2
U-value [W/m K] Thickness (m) ρ s (–) ε (–) versible water-to-water HPs AERMEC WFG9613 [39]. The rated
heating and cooling power of the HPs are equal to 1.8 MW and 1.7 MW
Roof 1.086 0.340 0.4 0.9
Façades 1.404 0.380 with rated coefficient of performance (COP) of 4.14 and 4.85, respec-
Ground floor 1.115 0.460 tively [39] (Table 5). The capacity of the heat pumps is selected by
Adjacent ceiling 1.792 0.290 taking into account the peak of demand for heating and cooling equal to
Windows glass 2.89 0.004/0.016/0.004 0.13 0.18 2.25 MW and 2.85 MW, respectively. DHW is provided by a district
heating network supplied by two water-to-water HPs AERMEC
WFG4812 [39] with a rated heating power of 1.0 MW (Table 5). The
Table 3
cooling loop of each HP is based on the seawater withdrawn from the
Number of occupied district buildings, Santa Maria di Salina and Favignana.
sea thermocline. Freshwater is produced by a RO equipped with
Type of Number of buildings SW30ULE-440i membranes [40]. In particular, the train consists of
Building three pressure vessels with eight membranes each. The electricity de-
Summer-Period (May- Winter-Period (October-April) mand of the district including the electric energy needed for the acti-
September) 2
vation of RO unit and HPs is matched by a PV field of 9333 m . The area
Salina Favignana Salina Favignana of the PV is selected in order to cover the maximum required power
peak. The selection of the RO capacity is selected by considering that
V1 378 344 155 280 the RO production must cover 70% of the maximum freshwater de-
V2 285 123 122 71
Off 16 10 16 10 mand. Note that when the produced solar power is not high enough for
H 20 20 2 2 matching the electricity demand of the district, the electricity is with-
Sch 0 0 3 2 drawn from the local grid of the island. When the power production is
greater than the demand, the surplus is delivered to the grid of the
island.
power is delivered to the local grid if the production overcomes the
The main economic, energy and environmental assumptions to
demand. Note that the cooling loop of ACH and ECH is based on the perform the dynamic simulations are reported in Table 6.
seawater withdrawn by the thermocline (T SW equal to 15 °C, Table 5).
The design of the area of the CPVT collectors, equal to 4800 m 2
(Table 4) is carried out considering results of the simulation of the re- 5. Results
ference buildings. In particular, in a preliminary analysis, the peaks of
the demand are calculated. The peak of the demand for space heating In this section, the hourly, weekly and yearly results of the dynamic
and desalination during winter is 3.18 MW, whereas the peak of de-
simulations for the two developed case studies of the two investigated
mand for the supply of the ACH and desalination is 4.48 MW; the peak layouts (PS1: CPVT-ACH-MED, PS2: CPVT-ACH-MED) in Salina and
of electricity demand is 0.92 MW. Considering the maximum heating
Favignana are presented. The developed simulation tool allows one to
demand and thermal efficiency of CPVT equal to 50%, the solar field mimic the real time operation of the investigated systems, using hourly
2
area results in 8960 m . Considering the maximum electricity demand
weather data of the selected locations. Dynamic results can be also
and electric efficiency of CPVT equal to 20%, the solar field area results integrated on other time bases (e.g. days, weeks, etc), in order to cal-
2
in 4620 m . In the first system, it is assumed that the value of 4800 m 2
culate the related energies and water mass. The dynamic simulations
is the most plausible, but it is necessary to perform a sensitivity analysis
account for freshwater, heating, cooling and DHW hourly demand and
to optimize the design.
the hourly values of the weather parameters of the islands, with a si-
The MED unit is designed to be supplied with 50 kg/s of hot water.
mulation time step equal to 0.025 h. A sensitivity analysis, performed to
Considering an inlet/outlet temperature difference of about 5 °C, the select the best configuration of the investigated plants from the eco-
required heat demand of the process is 1 MW. Therefore, the capacity of
nomic and energy point of view, is also presented.
AH for supporting the MED activation without solar energy is 1.2 MW
10