
Page 15 - Water-energy_2020
P. 15
F. Calise, et al. Energy Conversion and Management 220 (2020) 113043
Fig. 5. Favignana district thermal energy demand: heating (left) and cooling (right).
electricity demand, including the electricity demand of Salina district 5.4. Sensitivity analysis
and the electricity for the plant and RO unit, is lower than the elec-
tricity production of the PV panels. In fact, as it is possible to see, during For both PSs, a sensitivity analysis is performed in order to evaluate
these hours, PV panels completely satisfy the electric demand without the effect of the variation of the main design parameters of the plant on
using electricity of the local grid. The surplus of the power production is the system profitability. In particular, one of the key aspects in the
delivered to the local grid at 0.07 €/kWh. When the RO unit turns on, design of those plants is the selection of the capacity of the components.
an initial transient trend of the production is noted, followed by a stable In the initial design discussed above, solar field capacities were selected
3
freshwater production, equal to 13 m /h. It is possible to note that the in order to achieve a reasonable solar fraction, according to values
desalination unit only works during daytime. suggested by many published papers. Similarly, for the desalination
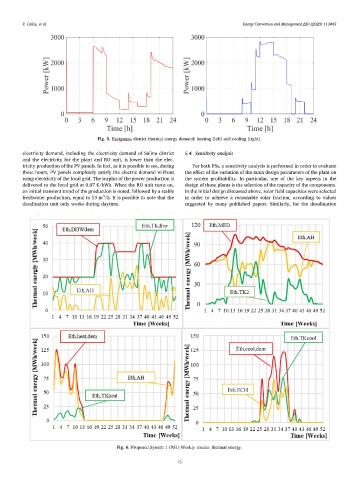
Fig. 6. Proposed System 1 (PS1) Weekly results: thermal energy.
15