
Page 23 - 23
P. 23
ARTICLE IN PRESS 1589
K. Lambeck et al. / Quaternary Science Reviews 23 (2004) 1567–1598
upper limit of the observed MIS 5.5 elevation and, at the The North Adriatic offshore data, comprising peats
level of observational accuracy, the location is effec- that are assumed to correspond to upper limits of sea
tively stable. level, are consistent with the assumption of zero tectonic
movement with all observed data points lying above or
within the predicted range (cf. Fig. 4). Likewise, the
observed coastal and inland data points are in broad
agreement with the model values, assuming subsidence,
to within the uncertainties of both values (Fig. 8).
Possibly the assumed subsidence rate for Caorle Lagoon
is too high and that for Grado Lagoon is too low but the
data is insufficient to estimate improved subsidence rates
and we retain the assumed rates based on the sparse
evidence from the location of the Last Interglacial sea
levels across the region. The implication of these results
is that the subsidence caused by loading from the Po
River sediments is restricted to the inland and coastal
zone and that it is not important for the offshore sites.
6.1.3. Further comments on comparisons
One feature of the nominal eustatic sea-level function,
and one that has been retained in the present solution, is
that ocean volumes have continued to increase into Late
Holocene time and this has been attributed to the
continued melting of the Antarctic ice sheet after the
completion of the melting of the northern ice sheets
(Nakada and Lambeck, 1988). This is consistent with
the recent results by Stone et al. (2003) that demonstrate
that significant melting has occurred in at least one part
of Antarctica. The eustatic sea-level curve for this post-
northern hemisphere glacial period is therefore impor-
tant for constraining the total changes in ice volumes.
Most analyses have indicated that much of this decay
occurred before about 2000–3000 years ago (Lambeck,
2002) and this is consistent with the Italian evidence
(Fig. 9) that supports eustatic levels below present
values in the interval 7–5 ka BP but the present Italian
data is not sufficiently accurate to establish better
constraints on this function for the more recent interval.
Some of the comparisons indicate differences that
exceed the uncertainties associated with both the
observed and predicted sea-levels values and this may
point to either limitations of the tectonic values adopted
or to data problems. For most of these sites the
comparisons are based on one or two observations only
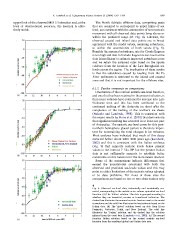
Fig. 6. Observed sea-level data, tectonically and isostatically cor-
rected, corresponding to the eustatic or ice-volume-equivalent sea level
function. (a) The ‘Italian’ solution. The data is grouped according to
whether they are terrestrial, marine or transitional indicators. The
dashed line illustrates the nominal eustatic function used in the model
corrections and the solid line illustrates the best estimate based on the
Italian data. (b) The ‘global’ solution based on data from Huon
Peninsula, Barbados, Tahiti, and New Zealand. The solid line
illustrates the ‘Italian’ solution and the dashed line the solution
inferred from the coral data (Lambeck et al., 2002). (c) The second
iteration Italian solution based on the revised eustatic sea-level
function from the combined global and Italian data sets.