
Page 20 - 23
P. 20
ARTICLE IN PRESS
1586 K. Lambeck et al. / Quaternary Science Reviews 23 (2004) 1567–1598
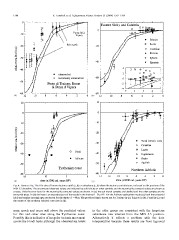
Fig. 4. Same as Fig. 3 but for sites of known tectonic uplift (a, b) or subsidence (c, d) where the tectonic contributions are based on the position of the
MIS 5.5 shoreline. The uncorrected observed values are indicated by solid circles or other symbols and the tectonically corrected values are shown as
crosses. Only the error bars for the tectonically corrected values are shown. In (a) the salt marsh samples are labelled and the other samples are the
terrestrial peats. In (b) the inset is an expanded part of the results in the interval 1–5 ka BP. For the Palinuro speleothem results (c) both the terrestrial
(old) and marine (young) ages are shown for the depth of B40 m. The predicted limits shown are for Traiano in (a), Rizzuto in (b), Fondi in (c), and
the centre of the northern Adriatic core sites in (d).
same epoch and occur well above the predicted values in the older group are consistent with the long-term
for this and other sites along the Tyrrhenian coast. subsidence rate inferred from the MIS 5.5 position.
Possibly this is indicative of irregular tectonic movement Alternatively it reflects a problem with the data
across the Fondi basin although the observed sea levels interpretation because these results are from lagoonal