
Page 21 - 23
P. 21
ARTICLE IN PRESS 1587
K. Lambeck et al. / Quaternary Science Reviews 23 (2004) 1567–1598
deposits within a glacial-epoch paleo-valley that is fed the isostatic component contributions are based partly
by springs from the surrounding Tertiary limestone on crustal rebound analyses of the formerly glaciated
deposits and the 14C ages of the lagoonal sediments may areas, but the uncertainty of this function remains
have been contaminated by old carbon. substantial. Thus we first investigate whether the present
data set can be used to improve upon this function in the
The other region of reported subsidence is from the interval from 0 to 12 ka BP.
northern Adriatic region. The core observations (25) are
reported as marsh deposits and represent upper limits to 6.1.1. The eustatic sea-level function
sea level. The model values illustrated in Fig. 4d are based The observed relative sea level at any location j and
on the assumption of zero subsidence and the observed
limits are generally consistent with this assumption. Not time t is written schematically as
all of the deposits could have been near sea level at the
ages indicated since data points with the same age of Dzobsðj; tÞ ¼ DzeðtÞ þ DzIðj; tÞ þ dzeðtÞ þ DzTðj; tÞ ð4Þ
B10.1 ka occur over a depth range of B10 m, consistent
with the present gradient of the sea floor and core-site
locations. With the exception of the Caorle Lagoon data,
the observed sea levels at coastal and inland sites lie
below the predicted values but, once corrected for
subsidence, agreement is much improved. The older of
two tectonically corrected observations at Conselice lies a
few meters above the upper limit of the predictions and
this is consistent with it being a terrestrial peat. The
observations from Grado Lagoon and Tagliamento are
mostly from shells in lagoonal deposits and correspond to
lower limits, and the results are consistent with the model
predictions. The tectonically corrected Caorle observa-
tions lie consistently above the predictions. Most of the
data points correspond to peat ages but the lagoonal shell
data point at 6.8 ka BP lies near the upper limit of the
predicted value, suggesting that the assumed subsidence
rate may have been too high.
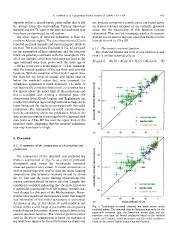
6. Discussion Fig. 5. Tectonically corrected observed sea levels versus model
predicted values. The observed data is illustrated separately for the
6.1. A summary of the comparison of observations and upper-limit terrestrial data, the lower-limit marine data, and the
predictions transition zone data. (a) Model predictions based on the nominal
eustatic and isostatic model parameters and (b) model predictions
The comparison of the observed and predicted sea based on the revised ‘Italian’ eustatic sea-level function.
levels is summarized in Fig. 5a as a plot of predicted
(horizontal axis) versus the tectonically corrected
observed (vertical axis) values. If model corrections as
well as predictions were perfect then the upper limiting
observations (the terrestrial markers) should lie above
the 1:1 line and the lower limiting observations (the
marine markers) should lie below this line. Largely this
condition is satisfied, indicating that the model provides
a reasonable representation of the eustatic–isostatic sea-
level change for this part of the Mediterranean. Never-
theless some significant discrepancies occur that suggest
that refinement of the model parameters is warranted.
As shown in Fig. 2c the choice of earth-model is not
critical within a wide range of parameters encompassing
results from earlier studies. A more critical choice is the
eustatic sea-level function. The nominal global function
used in the above comparisons is based on analyses of
sea level from regions far from the former ice sheets and