
Page 26 - 23
P. 26
ARTICLE IN PRESS
1592 K. Lambeck et al. / Quaternary Science Reviews 23 (2004) 1567–1598
5° 10° 15° 20° those for northern Tunisia. In fact, if Late Holocene sea-
45° 45° level indicators have been preserved along the section of
(i) coast between Tunis and Tripoli they should provide a
40° -0.28 -0.28 good test of the isostatic model. Nowhere within the
-0.45 -0.37 region are sea levels from stable coasts predicted to
occur above present sea level at any time during the
-1.09 Holocene, and the mid-Holocene highstands character-
istic of equatorial latitudes of Africa (Faure et al., 1980)
(ii) are absent here because the glacio-isostatic effect is still
sufficiently large to counteract the hydro-isostatic effect.
0.23 -0.11 0.08
0.15 0.35 The palaeo shorelines are obtained from the relation-
ship between water depth h(j, t) at time t and location j
(iv) relative to that h(j, t0) at time t0
40° hðj; tÞ ¼ hðj; t0Þ À Dzpredðj; tÞ;
0.87 (iii) where Dzpred(j, t) is the eustatic–isostatic prediction of
the change in sea level at time t since the time t0 (Fig. 7).
(iv) 0.63 1.15 The palaeo shoreline location is then given by the
1.97 contour h(j, t)=0. The water depths used here are from
the DTM compilation on a 2.5’ grid and the results are
1.72 devoid of detail in the smaller and shallow embayments.
During the LGM, at 20 ka BP (Fig. 12) the predicted
35° 35° isobases range from about À120 m in the Ga"bes Gulf
5° 10° 15° 20° (Tunisia) to À150 m in the middle of the basin and
extensive exposure of the shelves occurs in the North
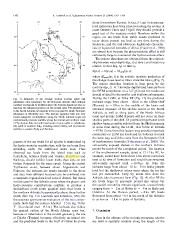
Fig. 11. Estimates of the average vertical tectonic uplift and Adriatic as well as along parts of the North African
subsidence rates (mm/year) for the Holocene interval. Sites without coast and marine LGM deposits will not occur on these
numbers correspond to localities where the tectonic signals are zero or shallow parts of the shelf. Of potential importance is the
less than the estimated precision of the vertical rates. The shaded zone shallow basin, possibly isolated from the Mediterranean
in the North Adriatic corresponds to the core sites for which Holocene at some time during the LGM, that forms at latitude
subsidence is effectively zero. The tectonic signature falls into four B43N. Cores from this feature may provide important
broad categories: (i) subsidence along the North Adriatic coast, (ii) constraints on LGM sea levels and ice volumes in much
predominantly tectonic stability along the central and northern coast the same way as did the cores from the Bonaparte Gulf
of Tyrrhenian Italy but with local areas of some uplift or subsidence, of northwestern Australia (Yokoyama et al., 2000). The
(iii) uplift in southern Italy, including eastern Sicily, and (iv) tectonic sub-aerially exposed shelves in the northern Adriatic
stability in western Sicily and Sardinia. persist for much of the Lateglacial period. The location
of the southernmost sample, dated at 13–11 ka BP, for
pattern of the sea levels for all epochs is determined by example, would have been about 13 m above coeval sea
the hydro-isostatic contribution, with the sea basin floor level at its time of formation and would have remained
subsiding under the additional water load. Thus sub-aerially exposed until B10.9 ka. At 10 ka the
observed sea levels from the island sites such as isobases range from about À55 to À35 m below present
Pantelleria, between Sicily and Tunisia, Marettimo and level but the shallowest values occur where the sea has
Sardinia, should exhibit lower levels than sites on the not yet encroached. Only by about 8 ka does the
Italian Peninsula for the same epoch. Along the central Adriatic take its present form (Fig. 12). At 6 ka BP the
Tyrrhenian coast, between about Argentarola and sea levels begin to approach present-day values but
Palinuro, the isobases are nearly parallel to the shore the spatial variability remains significant, coastal levels
and data from different locations can be combined into ranging from BÀ2 m at Ga"bes to BÀ9 m in Sicily and
a composite regional sea-level curve if desired. But this is Calabria. At the Roman period, B2 ka BP, levels
not the case for the Adriatic coast where the glacio- and fluctuated from about À0.5 in the north of the Adriatic
hydro-isostatic contributions combine to produce a to as low as À1.8 m in parts of Sardinia.
well-defined north–south gradient such that levels in
the northern Adriatic lie persistently above those further 7. Conclusion
south. (See Fig. 7 in Lambeck and Johnston, 1995, for
the separate approximate evaluation of the two compo- Even in the absence of the tectonic processes, relative
nents. Note that the contour labelled À1.5 in Fig. 7b for sea level is spatially variable along the length of the
T=2 ka should read À0.5 m.) The isobases also follow
the general outline of the North African coast but,
because of indentation in the coastal geometry, the site
at Djerba (Tunisia) becomes effectively an inland site
and the predicted levels in the Gulf of Ga"bes lie above