
Page 24 - 23
P. 24
ARTICLE IN PRESS
1590 K. Lambeck et al. / Quaternary Science Reviews 23 (2004) 1567–1598
and the following comments are more suggestions for
follow-up work than confirmed facts. As noted above,
the evidence from Fondi (9) indicates a local relative sea
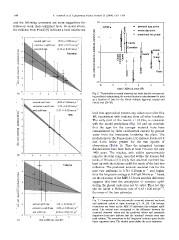
Fig. 8. Tectonically corrected observed sea levels less the correspond-
ing predicted values (using the nominal tectonic rates discussed in text)
as a function of time for the North Adriatic lagoonal, coastal and
inland sites (26–30).
level that approached present-day values soon after 8 ka
BP, inconsistent with evidence from all other localities.
The early part of the record, t>10.2 ka, is consistent
with the model predictions (Fig. 10) and we conclude
that the ages for the younger material have been
contaminated by older radiocarbon carried by ground
water from the limestones bordering the plain. The
predictions for the Pozzuoli site (11) indicate levels at 0.8
and 0.4 m below present for the two epochs of
observation (Table 1). Thus the integrated tectonic
displacements here have been at least 7 m over the past
1400 years. The notches, with widths approximately
equal to the tidal range, recorded within the Roman fish
tanks of Briatico (13) imply that sea-level rise here has
kept up with the tectonic uplift for much of the last two
millennia. The predicted isostatic sea-level rate for the
past two millennia is 0.7870.20 mm yrÀ1 and higher
than the long-term average at 0.4770.04 mm yrÀ1 based
on the elevation of the MIS 5.5 levels and this difference
suggests that here the assumption of constant uplift
during the glacial cycle may not be valid. Thus for this
site we adopt a Holocene rate of 0.6370.20 mm yrÀ1,
the mean of the two estimates.
Fig. 7. Comparison of the tectonically corrected observed sea-levels
and predicted values at three locations (15, 14, 10). The tectonic
corrections are based on the MIS 5.5 inferences (the nominal uplift
rates). The vertical axes correspond to the difference between the
corrected observed values and the predicted values and systematic
departures from zero indicate that the ‘nominal’ tectonic rates may
need revision. The corrections to the ‘long-term’ rates are given by the
linear regression lines. The shaded zones define the error estimates.