
Page 10 - Patella_ferruginea_Casu_Rivera_ali2011
P. 10
1302 Genetica (2011) 139:1293–1308
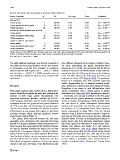
Table 4 ISSR dataset: three-level analysis of molecular variance (AMOVA)
Source of variation df SS Var. comp. % var. U-statistics
SAS and SCR
Among groups 1 238.461 2.101 21.07 U CT = 0.211***
Among populations within groups 26 638.136 2.542 25.49 U SC = 0.330***
Within populations 185 985.901 5.329 53.44 U ST = 0.466***
Alboran Sea, Siculo-Tunisian strait, and SCR
Among groups 2 257.173 1.829 18.80 U CT = 0.188***
Among populations within groups 25 619.424 2.570 26.42 U SC = 0.325***
Within populations 185 985.901 5.329 54.78 U ST = 0.452***
Cluster A, cluster B, and cluster C
Among groups 2 451.701 2.971 30.14 U CT = 0.301***
Among populations within groups 25 424.826 1.557 15.80 U SC = 0.226***
Within populations 185 985.901 5.329 54.06 U ST = 0.459***
Groups for three-level AMOVA were defined a priori (see text), either inferred according to PCA and model-based clustering analyses. df
degrees of freedom, SS sum of squares, var. comp. variance component, % var percentage of variation
*P\ 0.05; ** P \ 0.01; *** P \ 0.001
The eight additional haplotypes were directly connected to have different biological and ecological conditions (Bian-
the central one by only one mutation. The ML tree contains chi 2007). Interestingly, the genetic structuring found
no information as all taxa were collapsed in a polytomy between the SCR and the SAS groups fits with the surface
(data not shown). Both Tajima’s (D =-2.078, P \ 0.001) isotherms recorded in the Mediterranean during February:
and Fu’s (Fs =-16.495, P \ 0.001) neutrality tests on populations from the SAS group lie between the isotherms
COI displayed a significant departure from mutation-drift of 15 and 14°C, whereas the SCR group lie between the
equilibrium. isotherms of 14 and 13°C (Bianchi 2007). The population
history of P. ferruginea from SCR and SAS might thus
include fragmentation due to physical–chemical bound-
Discussion aries, followed by restricted gene flow among sub-basins.
Regardless to the causes of such differentiation, other
Inter-simple sequence repeat markers show a high level of marine invertebrates show a similar pattern of genetic
genetic variability throughout the study area, indicating the distribution (see Calvo et al. 2009 and references therein).
presence of three major genetic discontinuities. The Conversely, it is not easy to identify in the SCR group
uppermost hierarchical structure, detected by STRUC- the causes for the genetic structuring occurring between
TURE analyses, identified a genetic cluster corresponding cluster A, roughly corresponding to North-Western Sardi-
to samples from the SAS group and two genetic clusters in nia, and cluster B, which encompasses North-Eastern
the SCR group (Fig. 3a). Remarkably, grouping samples Sardinia and Corsica (Fig. 3a). This fact may be related to
into the three clusters maximised the portion of genetic the presence of an inhospitable sandy shore extending
differentiation among groups with respect to alternative almost continuously for about 100 km from the Asinara
grouping schemes, which, although significant, showed Island to Punta li Francesi that may represent a barrier to
lower fixation indices (Table 4). gene flow in West-East and viceversa direction. Although
The genetic break observed between the two main dispersal ability of larvae of patellogastropod limpets is
geographic areas considered in this study (the SAS group poorly known, data from laboratory experiments suggest
and the SCR group) is probably linked to the presence of a that larvae spread less than those of many marine inver-
barrier to gene flow represented by the Sardinian Channel. tebrates (see Nakano and Sasaki 2011 and reference
No data are available regarding the actual level of larval therein). Furthermore, Bird et al. (2007) suggested for
dispersal for P. ferruginea; however, a stretch of approxi- some Cellana species that variable currents among islands
mately 180 km of open sea, which separates North Africa could negatively affect gene flow. This may be the case
from Sardinia, is likely to be the most serious hindrance to here since the area analysed lies between Sardinia and
gene flow between the two regions. Furthermore, the clear Corsica islands, a geographic sector characterised by a
North–South geographic separation of these two groups complex circulation pattern (Pracchi and Terrosu Asole
coincides with some sub-basins of the Mediterranean that 1971).
123