Page 8 - Patella_ferruginea_Casu_Rivera_ali2011
P. 8

1300                                                                         Genetica (2011) 139:1293–1308


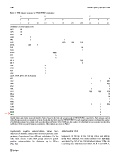
           Table 3 ISSR dataset: summary of STRUCTURE simulations
                     A                       B                                           C
                     1       2               3                 4                         5        6        7
                     I       II       III    IV      V         VI       VII      VIII    IX       X        XI
           Sardinian-Corsican region (SCR)
           ACS       10
           APS       10
           APB       10
           CDN                 9
           IPO                 3                                 1
           ARG                                                 8(4)     1(0)     2(1)
           MVE               1(0)     8
           PLF                                                                    10
           NAQ                                                                     3
           MAD                                       10(9)
           PIT                                          6
           CGR                                          8
           MLA                                                                   7(4)
           MLT                                                                     8
           GAL                               4
           CAR                               5
           TIZ                               1
           BOF                               1
           Spain, North Africa and Sicily (SAS)
           LIT                                                                             1                 4
           DIQ                                                                                      1      6(4)
           DES                                                                             1               3(2)
           PAR                                                                                               5
           CRL                                                                             2                 3
           ALB                                                                           2(0)     2(0)     2(0)
           MEL                                                                                              10
           CHA                                                                                              10
           PLA                                                                                               3
           HAB                                                                                               6
           CAP                                                                             2        1      7(6)
           ZEM                                                                                      5
           PAN                                                                                      1
           MAR                                                                                      2
           FAV                                                                                      2
           Capital letters and Arabic numerals identify clusters found in the first and second round of STRUCTURE, respectively. Each column marked
           with a Roman numeral corresponds to a cluster found after the third round of STRUCTURE. For each sampling location is indicated the number
           of individuals assigned to a cluster with a membership coefficient [0.5; if different, the number of individuals of pure ancestry (membership
           coefficient [0.8) is reported between parentheses. Abbreviations are given in Table 1


           Significantly  negative  autocorrelation  values  were  Mitochondrial DNA
           observed at distance classes that involved pairwise com-
           parisons of specimens from different subclusters. On the  Sequences of 581 bp (COI), 365 bp (12S), and 488 bp
           other hand, cluster C (the SAS group) showed a spatial  (16S) were obtained. The most common COI haplotype
           positive autocorrelation for distances up to 40 km  was shared by 165 of the 174 individuals (about 95%), the
           (Fig. 5d).                                         remaining nine distributed as follow: ALB 3 and CHA 5;


           123
   3   4   5   6   7   8   9   10   11   12   13