
Page 5 - Patella_ferruginea_Casu_Rivera_ali2011
P. 5
Genetica (2011) 139:1293–1308 1297
on subsets of data corresponding to the groups identified by
Bayesian-model based clustering.
Genetic structuring was also investigated by a hierar-
chical Analysis of Molecular Variance (AMOVA) using
the software package ARLEQUIN 3.52 (Excoffier and
Lischer 2010). The total variance was partitioned into
covariance components due to differences within popula-
tions, between populations within groups, and among
groups. Three different schemes of grouping were tested,
two of which were defined a priori: one scheme with two
groups corresponding to SCR and SAS groups; a second
scheme with three groups, because of the further subdivi-
sion of SAS group into Alboran Sea and Siculo-Tunisian
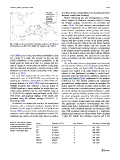
Fig. 2 Map of the main surface circulation pattern in the Western
Mediterranean, modified from Millot and Taupier-Letage (2005) Strait regions; the third scheme took into account the
results of model-based clustering analysis, corresponding
to the highest hierarchical genetic structuring. The signif-
icance of the fixation indices associated with the different
et al. (2005) is used. Next, the posterior probability of data levels of genetic structure was assessed by a non para-
for a given K is taken into account. In the case that metric permutation test with 10,000 replicates (Excoffier
LnP(D) (likelihood of the posterior probability of the et al. 1992).
model given the data) curve ends in a plateau, and DK, The relationship between geographical and individual
(rate of change of LnP(D)) does not retrieve a clear peak, pairwise genetic distances were investigated using Mantel
then, the individual assignment is examined using q value correlograms (Oden and Sokal 1986). The Mantel corre-
thresholds of 0.2/0.8 to denote membership in the cluster lograms were applied to the entire dataset as well as to
(Va ¨ha ¨ et al. 2007). subsets of data (partitioned according to model based-
For each data partition and for each value of K ten clustering) using the multivariate, multilocus approach of
independent runs of STRUCTURE were performed by Smouse and Peakall (1999) implemented in the program
applying the admixture model with correlated allelic fre- GENALEX 6.3. This method combines the information
quencies (Falush et al. 2003, 2007). Each run consisted of generated from multiple genetic markers to strengthen the
100,000 iterations that followed a burn-in period of spatial signal by reducing stochastic (allele-to-allele and
100,000 iterations to assess whether the results were con- locus-to-locus) noise. Individual pairwise genetic distances
sistent across different runs for each inferred value of are used to estimate the autocorrelation coefficient r, which
K. STRUCTURE analyses were performed on the CBSU measures the genetic similarity between pairs of individu-
Web Server, and graphical displays of the results were als whose geographic separation falls within a specified
generated using the software package DISTRUCT 1.1 distance class. The number and size of distance classes
(Rosenberg 2004). were set to compare similar sample size within each class.
In addition, we compared the results of the model-based The significance of positive autocorrelation was deter-
clustering with a Principal Coordinate Analysis (PCA) mined using both a permutation test (1,000 random per-
performed by the program GENALEX 6.3 (Peakall and mutations, 95% confidence interval) and bootstrap (1,000
Smouse 2006) on a matrix of interindividual distances via a reps, 95% confidence interval) estimates of r. Significant
covariance matrix with a data standardisation method. The spatial genetic structure was inferred either if the calculated
ordination was carried out on the entire dataset as well as r value fell outside this confidence interval and if the
Table 2 ISSR dataset: primer Primer Sequence (5 -3 ) No. of bands Size range of bands (bp)
0
0
names and sequences, number
of polymorphic bands per IT1 (CA) 8 GT 9 650–1500
primer and range of molecular
weight in base pairs (bp) IT2 (CA) 8 AC 6 600–1700
IT3 (CA) 8 AG 11 500–1600
SAS1 (GTG) 4 GC 8 550–1500
SAS3 (GAG) 4 GC 9 600–1500
UBC811 (GA) 8 C 7 500–1800
UBC827 (AC) 8 G 10 500–1600
123