
Page 4 - Spatial _distribution_Brugnano_2010
P. 4
Author's personal copy
314 C. Brugnano et al. / Journal of Marine Systems 81 (2010) 312–322
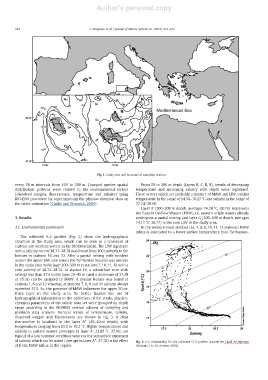
Fig. 1. Study area and locations of sampling stations.
every 50 m intervals from 100 to 300 m. Copepod species spatial From 50 to 200 m depth (layers B, C, D, E), trends of decreasing
distribution patterns were related to the environmental factors temperature and increasing salinity with depth were registered.
(dissolved oxygen, fluorescence, temperature and salinity) using These waters which are probably a mixture of MAW and LIW, exhibit
BIO-ENV procedure by superimposing the physico-chemical data on temperature in the range of 14.34–16.27 °C and salinity in the range of
the biotic ordination (Clarke and Warwick, 2004). 37.74–38.50.
Layer F (200–300 m depth, averages 14.28 °C, 38.74) represents
the Eastern Outflow Waters (EOW), i.e. eastern-origin waters already
3. Results undergone a partial mixing and layer G (300–600 m depth, averages
14.17 °C, 38.77) is the core LIW in the study area.
3.1. Environmental parameters In the western-most stations (i.e. 7, 8, 9, 10, 11, 12 stations) MAW
influx is associated to a lower surface temperature than Tyrrhenian-
The collected θ–Sprofiles (Fig. 2) show the hydrographical
structure in the study area, which can be seen as a crossroad of
eastern and western waters in the Mediterranean. The LIW signature
with a salinity core of 38.77–38.78 was found from 300 m depth to the
bottom in stations 10 and 12. After a partial mixing with resident
waters the upper LIW vein enters the Tyrrhenian Sea and was present
in the study area in the layer 200–300 m at stations 7, 10, 11, 12 with a
core salinity of 38.72–38.74. In station 10, a subsurface core with
salinity less than 37.5 in the layer 25–45 m (and a minimum of 37.29
at 35 m) can be assigned to MAW. A similar feature was found at
stations 1, 6 and 12 whereas, at stations 7, 8, 9 and 11 salinity always
exceeded 37.5. So, the presence of MAW influences the upper 50 m-
thick layer in the study area. To better finalise the use of
hydrographical information to the objectives of the study, physico-
chemical parameters of the whole data set were grouped by depth
range according to the BIONESS vertical scheme of sampling and
plankton data analysis. Vertical trends of temperature, salinity,
dissolved oxygen and fluorescence are shown in Fig. 3. A clear
thermocline is localized in the layer A* (20–40 m depth) with
temperatures ranging from 23.5 to 16.2 °C. Higher temperatures and
salinity in surface waters (averages in layer A: 22.85 °C, 37.90) are
typical of a late summer condition whereas the subsurface minimum
of salinity which can be noted (average in layer A*: 37.72) is the effect Fig. 2. θ–S relationship for the collected CTD profiles around the Egadi Archipelago
of fresh MAW influx in the region. (Stations 1 to 12, October 2004).