
Page 7 - Spatial _distribution_Brugnano_2010
P. 7
Author's personal copy
C. Brugnano et al. / Journal of Marine Systems 81 (2010) 312–322 317
located at 40 m and lower surface temperature) than more neritic and
coastal ones with a more marked Tyrrhenian influence (deeper DCM
and higher temperature).
The results of the present study provide basic information on the
spatial distribution of copepod species assemblage in coastal, neritic
and pelagic areas of the southern Tyrrhenian Sea, around the Egadi
Islands. The copepod abundance distribution pattern was character-
ized by classical decreasing trend from inshore to offshore and, in the
pelagic system, from surface to deeper waters. In the entire study area,
the copepod abundances were markedly lower than those reported
for other regions of the Mediterranean in the same season, such as,
Sicily Channel (Siokou-Frangou et al., 1997), Gulf of Lion (Gaudy et al.,
2003), and Ligurian Sea (Licandro and Icardi, 2009). In contrast,
Tyrrhenian (Vives, 1967; Scotto di Carlo and Ianora, 1983; Scotto di
Carlo et al., 1984, 1985), Ionian, Cretan and Levantine Seas (Pasteur et
al., 1976; Siokou-Frangou et al., 1997) have low abundances, similar
to those reported for Egadi Islands. The strong scarcity of the copepod
community is therefore linked to the oligotrophic character of the
Egadi Island Archipelago, as suggested by chlorophyll a values
measured during the present study.
Four groups of samples are identified for the Egadi Island area,
each one corresponding to a different environment, characterized by
different physical and biological conditions, as shown by PCA
ordination. Copepod assemblages seem only partly correlated to the
different identified water masses and relatively differentiated in
relation to coastal, neritic and pelagic environments. The first cluster
of samples groups mainly coastal, neritic and pelagic surface waters,
between 0 and 40 m depth layer, mostly affected by higher
temperatures and lower salinity. Its assemblage is mainly character-
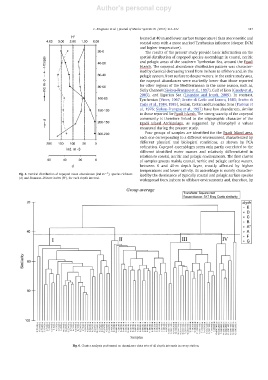
Fig. 5. Vertical distribution of copepod mean abundances (ind m −3 ), species richness ized by the dominance of typically coastal and pelagic surface species
(d) and Shannon–Wiener index (H′), for each depth interval.
widespread from inshore to offshore environments and, therefore, by
Fig. 6. Cluster analysis performed on abundance data sets of all depth intervals in every station.