
Page 5 - Spatial _distribution_Brugnano_2010
P. 5
Author's personal copy
C. Brugnano et al. / Journal of Marine Systems 81 (2010) 312–322 315
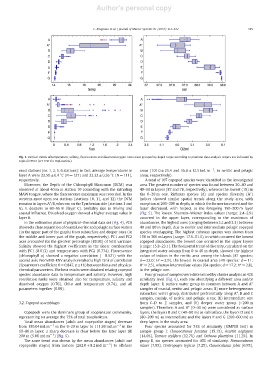
Fig. 3. Vertical trends of temperature, salinity, fluorescence and dissolved oxygen. Data were grouped by depth range according to plankton data analysis. Layers are indicated by
capital letters (see text for explanation).
most stations (i.e. 1, 2, 5, 6 stations): in fact, average temperatures in areas (101.0±25.4 and 16.8±12.5 ind.m −3 , in neritic and pelagic
layer A were 22.59±0.4 °C (N=127) and 23.32±0.26 °C (N=111), areas, respectively).
respectively. A total of 107 copepod species were identified in the investigated
Moreover, the Depth of the Chlorophyll Maximum (DCM) was area. The greatest number of species was found between 20–40 and
observed at about 40 m in station 10 coinciding with the intruding 40–60 m layers (87 and 78, respectively), whereas the lowest (19) in
MAW tongue, where the fluorescence maximum was recorded. In the the 0–20 m one. Richness species (d) and species diversity (H′)
western-most open sea stations (stations 10, 11, and 12) the DCM indices showed similar spatial trends along the study area, with
remains in layers A*/B, whereas on the Tyrrhenian side (stations 1 and exception at 200–300 m depth, in which the former increased and the
6), it deepens to 60–65 m (layer C), probably due to mixing and latter decreased, with respect to the foregoing 150–200 m layer
coastal influence. Dissolved oxygen showed a higher average value in (Fig. 5). The lowest Shannon–Wiener index values (range: 2.4–2.9)
layer B. occurred in the upper layer, corresponding to the maximum of
In the ordination plane of physical–chemical data set (Fig. 4), PCA abundances, the highest ones (ranging between 3.2 and 3.3) between
showed a clear separation of coastal, neritic and pelagic surface waters 40 and 80 m depth, due to neritic and intermediate pelagic copepod
(in the upper part of the graph) from subsurface and deeper ones (in species overlapping. The highest richness species was shown from
the middle and lower part of the graph, respectively). PC1 and PC2 150 to 300 m layers (range: 17.9–51.6), in which occurred the lowest
axes accounted for the greatest percentage (89.9%) of total variance. copepod abundances, the lowest one occurred in the upper layers
Salinity showed the highest coefficients in the linear combination (range: 15.8–23.1). The horizontal trend of diversity, calculated on the
with PC1 (0.613) and temperatures with PC2 (0.774). Fluorescence integrated water column from 0 to 40 m depth, showed the highest
(chlorophyll a) showed a negative correlation (−0.521) with the values of indices in the neritic area among the islands (81 species;
second axis. From BIO-ENV analysis resulted a high rank of correlation d=22.0; H′=2.9), the lowest in coastal area (49 species; d=11;
(Spearman's coefficient R=0.847, p≤1%) between biota and physico- H′=2.5), whereas intermediate values (64 species; d=17.2; H′=2.8),
chemical parameters. The best results were obtained relating copepod in the pelagic one.
species abundance data to temperature and salinity. However, high Four groups of samples were determined by cluster analysis at 42%
correlation ranks were obtained also for temperature, salinity and similarity level (Fig. 6), each one identifying a different area and/or
dissolved oxygen (0.76), Chl-a and temperature (0.74), and all depth layer: I) surface water group in common between A and A*
parameters together (0.69). samples of coastal, neritic and pelagic areas; II) more heterogeneous
subsurface water group, distributed preferentially along A*, B and C
samples, mainly, of neritic and pelagic areas; III) intermediate one
3.2. Copepod assemblages from C–D to E samples, and IV) deeper water group (N200 m
samples). Therefore, A and A* (0–40 m) were considered as surface
Copepods were the dominant group of zooplankton community, layers, the layers B and C (40–80 m) as subsurface, the layers D and E
representing on average the 75% of total zooplankton. (80–200 m) as intermediate and the layers F and G (200–600 m) as
Total mean abundances (adult and copepodite stages) decrease deep layers in the study area.
from 150.04ind.m −3 in the 0–20 m layer to 111.86 ind.m −3 in the Four species accounted for 53% of similarity (SIMPER test) in
60–80 m layer; a sharp decrease is clear below the later layer till sample group I: Clausocalanus furcatus (15.1%), Acartia negligens
200 m (5.00 ind.m −3 )(Fig. 5). (14.0%), Temora stylifera (12.7%) and Oithona plumifera (11.2%). In
The same trend was shown by the mean abundances (adult and group II, six species accounted for 40% of similarity: Nannocalanus
copepodite stages) from inshore (262.0±8.2 ind.m −3 ) to offshore minor (7.9%), Centropages typicus (7.2%), Clausocalanus jobei (6.9%),