
Page 3 - Colliard_ali_2010
P. 3
Colliard et al. BMC Evolutionary Biology 2010, 10:232 Page 3 of 16
http://www.biomedcentral.com/1471-2148/10/232
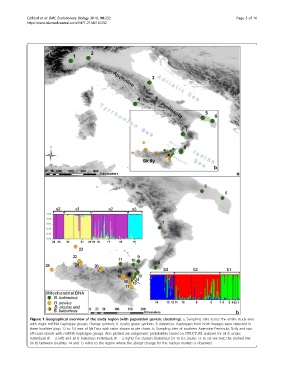
Figure 1 Geographical overview of the study region (with population genetic clustering). a. Sampling sites across the entire study area
with major mtDNA haplotype groups. Orange symbols: B. siculus; green symbols: B. balearicus. Haplotypes from both lineages were detected in
three localities (pop. 13 to 15) east of Mt Etna with ratios shown as pie charts. b. Sampling sites of southern Apennine Peninsula, Sicily and two
off-coast islands with mtDNA haplotype groups. Also plotted are assignment probabilities based on STRUCTURE analyses for all B. siculus
individuals (K = 3, left) and all B. balearicus individuals (K = 3, right). For clusters (balearicus: b1 to b3, siculus: s1 to s3) see text; the dashed line
(in b) between localities 14 and 15 refers to the region where the abrupt change for the nuclear markers is observed.