
Page 5 - Colliard_ali_2010
P. 5
Colliard et al. BMC Evolutionary Biology 2010, 10:232 Page 5 of 16
http://www.biomedcentral.com/1471-2148/10/232
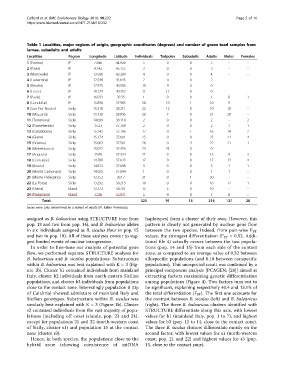
Table 1 Localities, major regions of origin, geographic coordinates (degrees) and number of green toad samples from
larvae, subadults and adults
Localities Region Longitude Latitude Individuals Tadpoles Subadults Adults Males Females
1 (Poirino) IP 7.846 44.920 5 0 0 5 - -
2 (Pavia) IP 9.142 45.155 3 0 0 3 - -
3 (Morrovalle) IP 13.586 43.280 4 0 0 4 - -
4 (Laurentina) IP 12.548 41.645 2 0 0 2 - -
5 (Brindisi) IP 17.475 40.586 10 9 0 0 - -
6 (Lecce) IP 18.174 40.353 11 11 0 0 - -
7 (Paola) IP 16.033 39.35 1 0 0 1 0 1
8 (Condofuri) IP 15.894 37.985 30 19 1 10 9 -
9 (San Pier Niceto) Sicily 15.318 38.211 22 12 0 10 10 -
10 (Mazzarrà) Sicily 15.138 38.096 28 7 0 21 20 -
11 (Torrenova) Sicily 14.699 38.118 2 0 0 2 - 2
12 (Fiumefreddo) Sicily 15.23 37.789 2 0 0 2 1 1
13 (Calatabiano) Sicily 15.243 37.796 17 0 1 16 14 2
14 (Giarre) Sicily 15.174 37.691 25 0 0 25 21 4
15 (Gravina) Sicily 15.063 37.561 26 0 4 22 21 1
16 (Misterbianco) Sicily 15.022 37.476 24 24 0 0 - -
17 (Augusta) Sicily 15.08 37.334 21 0 8 13 9 3
18 (Centuripe) Sicily 14.788 37.643 17 0 0 17 13 4
19 (Bronte) Sicily 14.813 37.698 3 0 0 3 1 1
20 (Monte Carbonara) Sicily 14.025 37.894 1 0 0 1 1 -
21 (Monte Pellegrino) Sicily 13.352 38.17 31 0 1 30 - -
22 (La Fossa) Sicily 13.292 38.213 18 0 0 18 17 1
23 (Ustica) Island 13.172 38.701 15 5 0 10 - -
24 (Favignana) Island 12.36 37.921 5 4 0 1 0 -
Total 323 91 15 216 137 20
Sexes were only determined in a subset of adults (IP: Italian Peninsula).
assigned as B. balearicus using STRUCTURE (one from haplotypes) form a cluster of their own. However, this
pop. 13 and two from pop. 14), and B. balearicus alleles pattern is clearly not generated by nuclear gene flow
in six individuals assigned as B. siculus (four in pop. 15 between the two species. Indeed, from pair-wise F ST
and two in pop. 18). All of these analyses concur to sug- values, the strongest differentiation (F ST = 0.52, Addi-
gest limited events of nuclear introgression. tional file 4) actually occurs between the two popula-
In order to fine-tune our analysis of potential gene tions (pop. 14 and 15) from each side of the contact
flow, we performed separate STRUCTURE analyses for zone,ascomparedtoanaverage value of0.32between
B. balearicus and B. siculus populations. Substructure allospecific populations (and 0.18 between conspecific
within B. balearicus was best explained with K = 3 (Fig- populations). This unexpected result was confirmed by a
ure 1b). Cluster b1 contained individuals from mainland principal component analysis [PCAGEN; [28]] aimed at
Italy, cluster b2 individuals from north-eastern Sicilian extracting factors maximizing genetic differentiation
populations, and cluster b3 individuals from populations among populations (Figure 4). Two factors turn out to
close to the contact zone. Interestingly population 8 (tip be significant, explaining respectively 40.4 and 13.1% of
of Calabria) showed admixture of mainland Italy and the total differentiation (F ST ). The first one accounts for
Sicilian genotypes. Substructure within B. siculus was the contrast between B. siculus (left) and B. balearicus
similarly best explained with K = 3 (Figure 1b). Cluster (right). The three B. balearicus clusters identified with
s2 contained individuals from the vast majority of popu- STRUCTURE differentiate along this axis, with lowest
lations (including off coast islands, pop. 23 and 24), values for b1 (mainland Italy, pop. 1 to 7), and highest
except for populations 21 and 22 (north-western coast values for b3 (pop. 12 to 14, close to the contact zone).
of Sicily, cluster s1) and population 15 at the contact The three B. siculus clusters differentiate mostly on the
zone (cluster s3). second factor, with lowest values for s1 (north-western
Hence, in both species, the populations close to the coast, pop. 21 and 22) and highest values for s3 (pop.
hybrid zone (showing coexistence of mtDNA 15, close to the contact zone).