
Page 6 - Colliard_ali_2010
P. 6
Colliard et al. BMC Evolutionary Biology 2010, 10:232 Page 6 of 16
http://www.biomedcentral.com/1471-2148/10/232
Table 2 Percentage of potential hybrids detected in populations where hybrids are expected or likely to occur
MtDNA Nuclear DNA Hybrids, based on
Population N B. B. pure B. pure B. NewHybrids Diagnostic Cytonuclear
balearicus siculus balearicus siculus alleles disequilibrium
13 (Calatabiano) 16 15 1 14 0 2 1 1
100% 93.75% 6.25% 87.50% 0% 12.50% 6.25% 6.25%
14 (Giarre) 25 17 8 25 0 0 2 8
100% 68% 32% 100% 0% 0% 8% 32%
15 (Gravina) 26 13 13 0 26 0 4 13
100% 50% 50% 0% 100% 0% 15.38% 50%
16 24 0 24 0 24 0 0 0
(Misterbianco)
100% 0% 100% 0% 100% 0% 0% 0%
18 (Centuripe) 17 0 17 0 15 2 2 0
100% 0% 100% 0% 88.24% 11.76% 11.76% 0%
MtDNA: Numbers and percentages of individuals containing either B. balearicus or B. siculus mtDNA. Nuclear DNA: Numbers and percentages of individuals
assigned by STRUCTURE to either B. balearicus or to B. siculus. Hybrids based on: potential hybrids detected using a) NEWHYBRIDS software, b) diagnostic
microsatellite alleles or c) cyto-nuclear disequilibrium.
The spread of clusters correlates with geography, Northern Sicily, down to 0.38 at the contact zone (pop.
which translates into some isolation by distance. The 14). Similarly (though to a lesser extent), genetic diver-
relationship between genetic differentiation and geo- sity in B. siculus populations decreases from Hs = 0.75
graphic distance is strong and significant in both species South and West of the Mount Etna (pop. 17 and 18) to
when dropping the three populations (pop. 13 to 15) at 0.62 in populations closer to the contact zone (pop. 15
2
the contact zone (r = 0.81, R = 66%, p = 0.0026 for and 16; Additional file 1, see also [24] for representative
2
B. balearicus, and r = 0.41, R =17%,p =0.035 for populations).
B. siculus), but drastically reduced when including these
three populations, due to strong differentiation over Crossing experiments
2
short geographic distances (r = 0.23, R =8.72%,p = From an F 1 -cross B. balearicus x B. siculus obtained in
2
0.25 for B. balearicus, and r = 0.21, R =4.65%,p= spring 2007, about 80% offspring were viable and devel-
0.47 for B. siculus). oped normally (Table 3). The remaining 20% did not
This enhanced differentiation between populations hatch or produced malformed, dwarfed and/or leucistic
close to the contact zone correlates with increased larvae (Figure 5c-f). Most of these died at early stages or
genetic drift and loss of diversity. Genetic diversity in B. during metamorphosis (four-legged stage), and a few
balearicus populations decreases from Hs = 0.74 in ones survived as never-metamorphosing “giant” tadpoles
mainland Italy (pop. 5 and 6) to 0.54 in Calabria and (Figure 5f). The reciprocal cross (B. siculus x
B. balearicus Both B. siculus mtDNA
1.00
0.80
0.60
0.40
0.20
0.00
9 11 13 15 17 19 21 25
10 12 14 16 18 20 22 Pop.
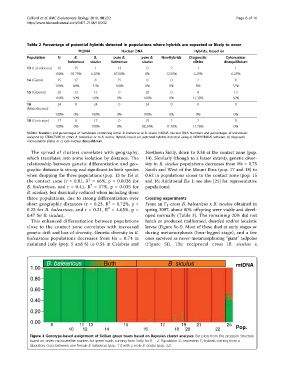
Figure 3 Genotype-based assignment of Sicilian green toads based on Bayesian cluster analyses. Bar plots from the program Structure
based on seven microsatellite markers for green toads coming from Sicily for K = 2. Population 25 represents F 1 -hybrids coming from a
laboratory cross between one female B. balearicus (pop. 11) with a male B. siculus (pop. 22).